


Today we started breaking down the geoduck experiment at Pt. Whitney. We turned off the Apex and cleaned and stored all probes. CO2 lines were removed from conicals and secured. We moved most of our materials back up to the lab where we organized and cleaned so that the areas are available for the hatchery workers to use and the materials are safe until Sam returns. The geoduck are still in their original heath trays however only their gravity flow is left to be removed. This task will be done tomorrow when Steven and Brent arrive. I took lots of photos. Here are a few!


After finish the analyses using Hisat program and complemented with stringtie, the differential expression analysis in R using the libraries:
library(ballgown)
library(RSkittleBrewer)
library(genefilter)
library(dplyr)
library(devtools)
and command lines like:
pheno_data = read.csv(“/Volumes/toaster/roberto/phenodata_day30.csv”)
bg_Cragi = ballgown(dataDir = “/Volumes/toaster/roberto/Hisat_results/stringtie_results/Est_abundance/ballgown30/”, samplePattern = “Os”, pData=pheno_data)
bg_Cragi_filt = subset(bg_Cragi,”rowVars(texpr(bg_Cragi)) >1″,genomesubset=TRUE)
#To look for diff expr between thermal tolerance:
results_transcripts = stattest(bg_Cragi_filt, feature=”transcript”,covariate=”thermal.tolerance”,adjustvars = c(“family”), getFC=TRUE, meas=”FPKM”)
results_genes = stattest(bg_Cragi_filt, feature=”gene”, covariate=”thermal.tolerance”, adjustvars = c(“family”), getFC=TRUE, meas=”FPKM”)
#This is to add gene names and gene IDs to the results_transcripts data frame
results_transcripts = data.frame(geneNames=ballgown::geneNames(bg_Cragi_filt), geneIDs=ballgown::geneIDs(bg_Cragi_filt), results_transcripts)
#Then, to sort the results from the smallest P value to the largest:
results_transcripts = arrange(results_transcripts,pval)
results_genes = arrange(results_genes,pval)
#To write the results to a csv file:
write.csv(results_transcripts, “Cragi_transcript_results_D30.csv”, row.names=FALSE)
write.csv(results_genes, “Cragi_gene_results_D30.csv”, row.names=FALSE)
#To identify transcripts and genes with a q value subset(results_transcripts,results_transcripts$qvalsubset(results_genes,results_genes$qvaltropical= c(‘darkorange’, ‘dodgerblue’, ‘hotpink’, ‘limegreen’, ‘yellow’)
palette(tropical)
fpkm = texpr(bg_Cragi,meas=”FPKM”)
fpkm = log2(fpkm+1)
boxplot(fpkm,col=as.numeric(pheno_data$thermal.tolerance),las=2,ylab=’log2(FPKM+1)’)

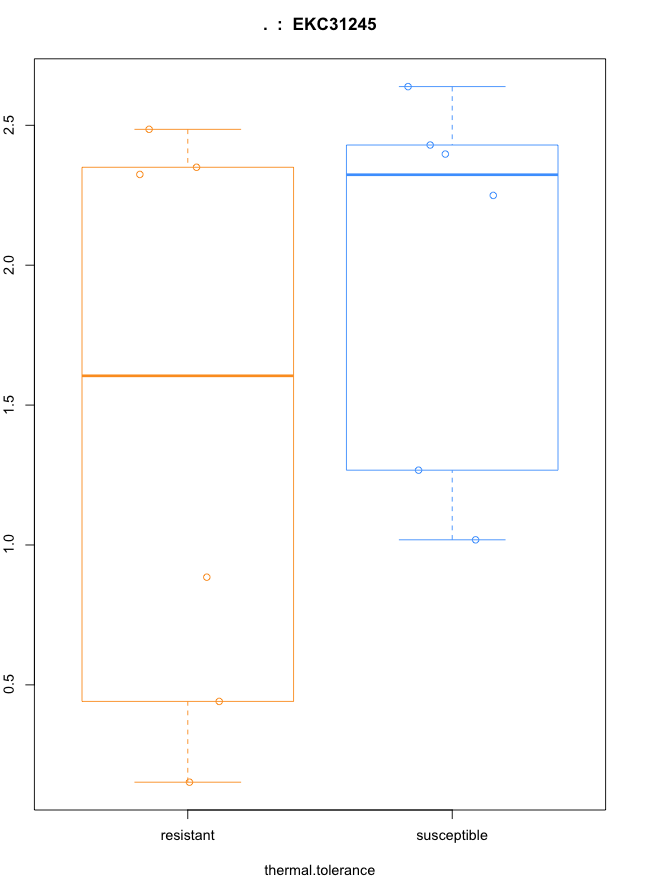
##As an example, the observation of differential expression of particular gene (with its isoforms):
ballgown::transcriptNames(bg_Cragi)[4295]
plot(fpkm[4295,] ~ pheno_data$thermal.tolerance, border=c(1,2), main=paste(ballgown::geneNames(bg_Cragi)[4295],’ : ‘, >ballgown::transcriptNames(bg_Cragi)[4295]),pch=19, xlab=”thermal.tolerance”, ylab=’log2(FPKM+1)’)
points(fpkm[4295,] ~ jitter(as.numeric(pheno_data$thermal.tolerance)), col=as.numeric(pheno_data$thermal.tolerance))
#Then, the observation of this gene differentially expressed in a single sample:
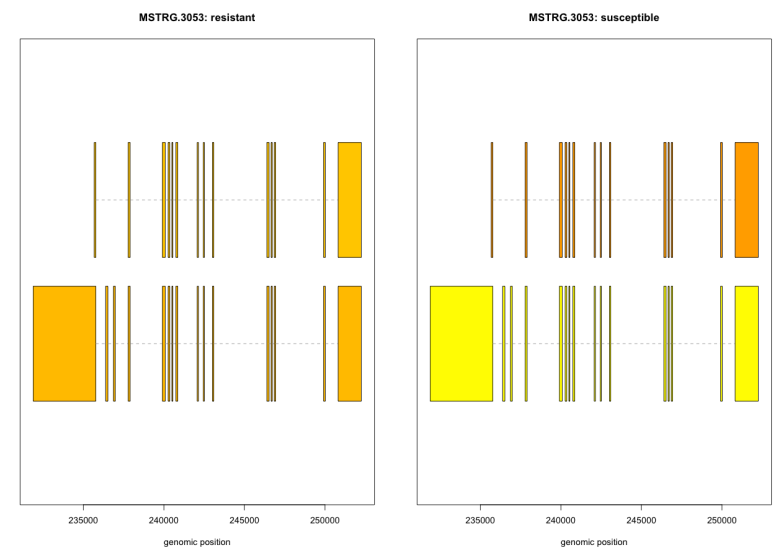
plotTranscripts(ballgown::geneIDs(bg_Cragi)[4295], bg_Cragi, main=c(‘Gene MSTRG.3053 in sample Os15’), sample=c(‘Os15’))
For this it was necessary to look for the gene id (MSTRG.3053) in matrix file and add it to the command line.
#As a las step. The visualization of expression of isoforms between resistant and susceptible families and the position of these in the genome:
plotMeans(‘MSTRG.3053’, bg_Cragi_filt,groupvar=”thermal.tolerance”,legend=FALSE)
I am still working in the comparison of data obtained with Hisat/stringtie and the data from Trinity.
https://github.com/sr320/nb-2018/blob/master/C_gigas/01-blastn-Roberto.ipynb
Last week I worked at Pt.Whitney and was toured around the facility by Sam. He showed me how to do titrations to determine alkalinity as well. I helped him take daily measurements of pH, temperature and salinity for each tray and conical. Once the dosing pumps arrived on last Tuesday, I helped him set up the next part of his experiment. I labelled tubes and snap frooze 8 geoduck from each treatment, then we worked as a team to move the top rows of health trays to different treatments. This was a difficult and long task because we wanted to be sure geoduck didn’t escape their isolation chambers but the quarters were tight for movement due to beams and the trays were quite heavy. Some pipes have to be removed and the conical need to be lowered to make moving the trays possible. We heard some air leaking from the CO2 canisters after the movement and had to find a wrench and soap to stop any leakage as well as clear the lines and clean the banjos. Nevertheless we were successful in our task! I also helped do algae counts and changed out the algae bucket which lasts for 24 hours to feed the larvae. Sam does respirometry on the juveniles every other day as well. I shadowed him moving the geoducks into the respirometry wells since it is a task that needs to be done quickly to prevent hypoxia. While waiting for titrations and respirometry measurements to be completed, I measured the geoduck larvae on ImageJ. These length measurements are used to correct respiration calculations. Before I left on Wednsday, I finished measuring larvae and helped Sam take daily measurements. We noticed that the temperature was much higher than it had been in previous measurements so we saw that the temperature had changed Tuesday evening. We believed that when we cut off flow to the tanks, the system switched to lagoon water which may be warmer. However, the chiller should be working to prevent any change so it could also have been a problem with the chiller. Fortunately all the trays were of equal temperature at least.
I arrived early today to help Sam with the final day of his experiment. It was the same long procedure as before except we didn’t have to change treatments. First, we took all of the daily measurements and I helped Sam with the tris calibration. Then I worked with Sam and used the cell counter to measure algae densities of Iso, Pav and Tet. The machine was really cool and much better than the haemocytometer! Once we knew the density, we could plug the numbers into Sam’s code which he made based on previous literature. This gave us the amounts to use in the buckets so I filled the 24 hour bucket like last week. Next was respirometry and prepping for snap freezing. I labelled tubes and emptied and removed labels from all of the old titration samples while Sam did respirometry. Once that was finished, we headed back to the hatchery. We only had to move the top health trays to access the geoduck in the bottom to snap freeze them this time although the pipes and conicals still have to be removed and drained.
Tomorrow we are breaking down the experiment and moving the geoduck to a different part of the hatchery. We will also make sure everything is tidied up and organized for when Sam returns. I will take photos of the geoduck setup and lab tomorrow!
Today I met with Steven and Sam to make a new plan for the crab RNA problem. We’re going to use the lyophilizer (freeze drying machine that goes below -80˚C) on 8 new pelleted hemolymph samples from Day 26; 8 supernatant samples that correspond to those 8 pelleted; and a pooled sample of all the ones Sam processed using the Qiagen RNeasy Kit that had “out of range” Qubit results. This will have to be post-poned for a bit becuase the lyophilizer is currently being fixed… waiting for an ETA on that. In regards to Skyline, I re-visited what I did before I left for vacation and went through all the files used and settings chosen. I put all of the information in a new GitHub issue per Steven’s request.
Sam processed the 40 samples that I picked out from Day 26 (samples taken in triplicate) using the Qiagen RNeasy Kit. 15 of the 40 had detectable RNA with the Qubit. Here is a link to his notebook post: RNA Isolation & Quantification – Tanner Crab Hemolymph.
Steven, Sam, and I talked a little before lab meeting to come up with a new game plan. I picked out 8 more samples (2 from each treatment group from day 26 except for the warm). I pulled out the pelleted hemolymph as well as the supernatant (RNAlater) that may have some cells in it.

I also pooled together all of the samples that Sam processed that had “out of range” Qubit results.

THe plan (once the Lyophilizer is fixed/ if it is fixed) is to put the samples in the lyophilizer (freeze dryer) overnight, then try out the Tri-reagent protocol on the 8 pelleted and 8 supernatant samples. I will re-quanitifiy the pooled sample using the QUbit.
Based on what happens with that, we’ll decide what else to do going forward. But we want to send off a tube for sequencing ASAP so that we can get things moving.
I made a GitHub issue (#341) detailing the issues I’ve had since using Walnut to make the new BLIB file. Assigned Emma to the issue and am awaiting her response.
from Grace’s Lab Notebook https://ift.tt/2Oyflp0
via IFTTT
Read The epigenetic landscape of transgenerational acclimation to ocean warming to get an idea for potential analysis methods. The authors used different functions in methylKit to obtain DMRs:
"Briefly, the ‘methRead’ function of methylKit reads the mapping results with 10 reads per cytosine as a minimum coverage threshold. High coverage bases (99.9%) were filtered to exclude potential PCR bias and then normalized using ‘filterByCoverage’ and ‘normalizeCoverage’ functions, respectively. Genomic regions were categorized as CpG island, CpG shore, promoter, 5′ untranslated region (UTR), exon, introns, 3′ UTR and repeats. Methylated or unmethylated cytosines in each genomic region were summed for each sample by the ‘regionCounts’ function of methylKit. The P values of methylation differences for each region between two samples were calculated using a chi-squared test in the ‘calculateDiffMeth’ function."
They also generated heatmaps with DMR data, which would be useful in my case as well.
In BEDtools, they used the closest function to pair DMRs and genes:
"The closest gene to a DMR on the same scaffold was identified using ‘closest’ from BEDTools v. 2.2339. This resulted in 1,563 genes from 2,078 CpG DMRs, while 115 DMRs were on scaffolds without annotated genes (Supplementary Table 4)."
Because they paired gene expression data with epigenetic data, they did not do any gene enrichment. I’ll need to refer to Emma’s geoduck paper for those methods.
TL;DR Nothing really works.
I used the same protocol as the last two trials, but with one alteration. Sam suggested I try four different methods for lysating my samples (Steps 12-13):

Figure 1. Tissue Tearor used for protocol.

Figure 2. 5 notches (left) and 1 notch (right)


Figures 3-4. Division of tissues for histology.
Table 1. Tube number, initial sample added, and DNA concentration. All of these concentrations are too low for downstream appliciations, and there does not seem to be any pattern regarding method and yield. T2-V2 yield was too low for the Qubit to measure.
| Tube | Initial Mass (g) | DNA Concentration (ng/µL) |
|---|---|---|
| T1-TT | 0.0211 | 2.09 |
| T1-V2 | 0.0210 | 1.72 |
| T1-V5 | 0.0206 | 2.82 |
| T1-V10 | 0.0208 | 0.524 |
| T2-TT | 0.0208 | 2.05 |
| T2-V2 | 0.0204 | N/A |
| T2-V5 | 0.0201 | 0.484 |
| T2-V10 | 0.0204 | 0.804 |
| T3-TT | 0.0202 | 9.60 |
| T3-V2 | 0.0205 | 6.20 |
| T3-V5 | 0.0205 | 0.644 |
| T3-V10 | 0.0202 | 2.92 |
Seeing how these changes to the protocol are not working and I have to return the thermomixer first thing Monday morning, I think I should move on to either 1) RNA extractions from the histology cassettes or 2) DNA extractions from ctenida, mantle, or adductor tissue. I updated this issue for a response.
// Please enable JavaScript to view the comments powered by Disqus.
from the responsible grad student https://ift.tt/2MayWPn
via IFTTT
[sr320@mox2 jobs]$ cat 0809_1500.sh
#!/bin/bash
## Job Name
#SBATCH --job-name=angsd-05
## Allocation Definition
#SBATCH --account=srlab
#SBATCH --partition=srlab
## Resources
## Nodes (We only get 1, so this is fixed)
#SBATCH --nodes=1
## Walltime (days-hours:minutes:seconds format)
#SBATCH --time=10-100:00:00
## Memory per node
#SBATCH --mem=100G
#SBATCH --mail-type=ALL
#SBATCH --mail-user=sr320@uw.edu
## Specify the working directory for this job
#SBATCH --workdir=/gscratch/srlab/sr320/analyses/0809b


source /gscratch/srlab/programs/scripts/paths.sh


/gscratch/srlab/sr320/programs/angsd/angsd -bam /gscratch/srlab/sr320/data/cw/all_bam.bamlist -out Genotypes_parentage2 -GL 1 -doMaf 1 -doMajorMinor 1 -minMaf 0.1 -SNP_pval 1e-6 -minInd 525 -minQ 20 -P 28 -doGeno 2 -doPost 1 -postCutoff 0.95 -doCounts 1 -geno_minDepth 5[sr320@mox2 jobs]$
[sr320@mox2 jobs]$ cat 0809_1300.sh
#!/bin/bash
## Job Name
#SBATCH --job-name=angsd-05
## Allocation Definition
#SBATCH --account=srlab
#SBATCH --partition=srlab
## Resources
## Nodes (We only get 1, so this is fixed)
#SBATCH --nodes=1
## Walltime (days-hours:minutes:seconds format)
#SBATCH --time=10-100:00:00
## Memory per node
#SBATCH --mem=100G
#SBATCH --mail-type=ALL
#SBATCH --mail-user=sr320@uw.edu
## Specify the working directory for this job
#SBATCH --workdir=/gscratch/srlab/sr320/analyses/0809


source /gscratch/srlab/programs/scripts/paths.sh


/gscratch/srlab/sr320/programs/angsd/angsd \
-bam /gscratch/srlab/sr320/data/cw/all_bam.bamlist \
-out Association_test2 \
-doAsso 1 \
-yBin /gscratch/srlab/sr320/data/cw/YBin_file \
-GL 1 \
-doMaf 1 \
-doMajorMinor 1 \
-minMaf 0.01 \
-SNP_pval 1e-6 \
-minInd 468 \
-minQ 20 \
-doGlf 3 \
-P 28


